How to Prepare a Risk Map
Contents
Preparation of Risk Maps - Technical Brief
Introduction
This document addresses the risk maps that resulted from the experience carried out in the emergency preparedness project in Peru. The methodology will have to be revised according to other more comprehensive risk reduction experiences and strategies that are being implemented institutionally but that lack instruments such as the one described here.
Conceptual approach
Risk
Risk is defined as the probability that people may suffer injuries or damages because of a disaster. Risk may be calculated, based on three elements: a) the frequency and severity of a threat, b) the vulnerability, and c) capacity of people, communities and institutions to respond to such a threat and recover from its impact.
Therefore, the greater the risk, the greater the vulnerability of a community and the lower its response and recovery capacity.
Risk map
The purpose of a risk map is to identify and classify areas, taking into account the probable damages that could occur as a result of a disaster.
What is a threat?
A threat is defined as the probability that a potentially destructive or damaging phenomenon or event may occur (earthquakes, "huaycos," floods, landslides, tsunamis, droughts, wars, epidemics), and impact on determined vulnerability conditions.
What is vulnerability?
Vulnerability is defined as the characteristics of individuals, groups, or societies that determine its degree of exposition to a threat or risk. Key characteristics include class, ethnicity, gender, disability, age, and condition.
The groups that are especially vulnerable are those for whom it is difficult to survive and to rebuild housing following a disaster.
File:P001b.jpg
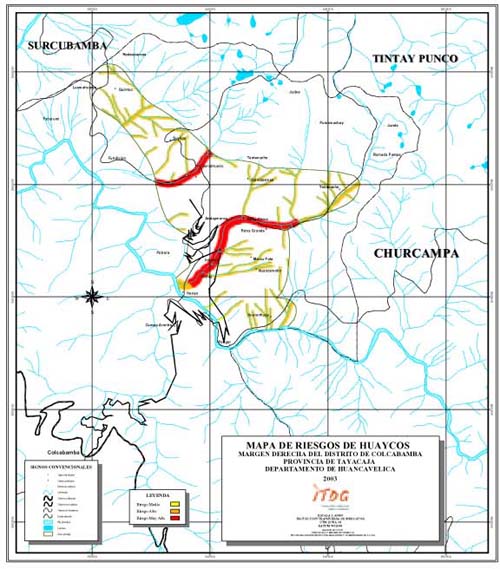
Risk map prepared by a member of the community
Outline for the preparation of risk maps by using geographic information systems
How are threat maps prepared?
1. Initial inputs
2. Field trip
3. Preparation of threat maps
4. Analysis of the threat map
The threat map obtained in the previous step is made up of numbers that need to be reclassified to assign them qualitative values.
For example, the following table displays the numbers obtained in the threat map.
|
|
|
|
|
|
|
|
|
|
|
|
|
|
|
|
Low: |
Expresses minimal values and does not constitute a potential threat |
|
Medium: |
Expresses intermediate values and could constitute a potential threat |
|
High: |
Expresses high values and constitutes a threat |
|
Very high: |
Expresses very high values and constitutes an extreme threat |
For example
|
A community which is located on a steep slope and receives a lot of precipitation in thesummer months is considered at a value of 4, whereas the same community in a slightly flatarea, but also receiving precipitation is considered at a value of 1. |
5. Validation of the landslide map in workshop and preparation of the final version.
How are vulnerability maps prepared?
1. Initial inputs
[p004a.gif File:P004a.gif]
2. Field trip
3. Preparation of the vulnerability map
|
• Completion of the vulnerability forms. • Preparation of a database. • Preparation of the vulnerability map taking into consideration three aspects:
|
|
|
|
|
|
|
|
|
|
|
|
|
|
|
|
|
Low: |
Expresses minimal values and does not constitute a potential threat |
|
Medium: |
Expresses intermediate values and could constitute a potential threat |
|
High: |
Expresses high values and constitutes a threat |
|
Very high: |
Expresses very high values and constitutes an extreme threat |
For example
|
One of the vulnerability variables is the difficult access to communities. Roads are unpaved andonly four are suitable for motor vehicles, which gives those communities that only have unpavedunsuitable roads a value of 4. Another community located in a slightly flat area and also receiving precipitation is considered at avalue of 1. |
4. Producing the vulnerability map
What are risk maps used for?
• Risk maps allow the identification of the location of the risks and threats.
• They offer authorities and organisations ideas, shared with the community and experts, to make decisions and know what the existing dangers and threats are.
• All local stakeholders take part, analyse, and allow us to understand their perception of the situations.
• Maps allow registering historical events that have negatively affected the community.
• They help to prepare for emergencies.
|
For more information: |
Practical Action, The Schumacher Centre for Technology & Development
Bourton Hall, Bourton-on-Dunsmore, Rugby, Warwickshire CV23 9QZ, UK
Tel: +44 (0)1926 634400 Fax: +44(0)1926 634401 E-mail: infoserv@practicalaction.org.uk Web: http://www.practicalaction.org
Intermediate Technology Development Group Ltd Patron HRH -The Prince of Wales, KG, KT, GCB
Company Rag. No 871964. England Rag. Charity No 247257 VAT No 241 6164 92
